Heat Map (kartodiagramma) Russia (Excel 2007+)
Sold 1
Refunds 0
Good feedbacks 0
Bad feedbacks 0
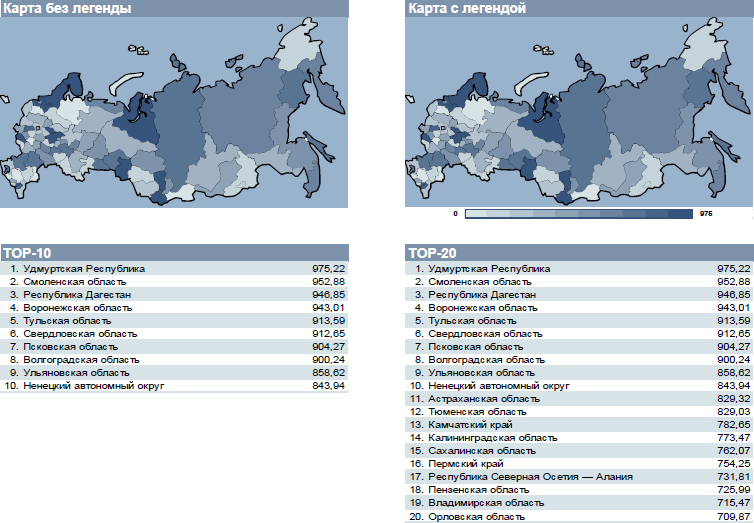
Heat Map (kartodiagramma) is used for the graphic representation of numerical data, linked to the region on the map of Russia.
Printable versions optimized for Excel 2007+ (2007, 2010, 2013).
Using heat map will help a glance our study on a national scale, examples of which may include:
- Study the scope of export / import products,
- Study of the level of consumer prices,
- The study of indicators of industry,
- Research in living standards and employment,
- The study of indicators of budgets,
- Research the number of customer service points
and any other study.
By itself, the map is a vector image that can be copied into any application while preserving format. Thus, it is possible to scale the image without losing quality.
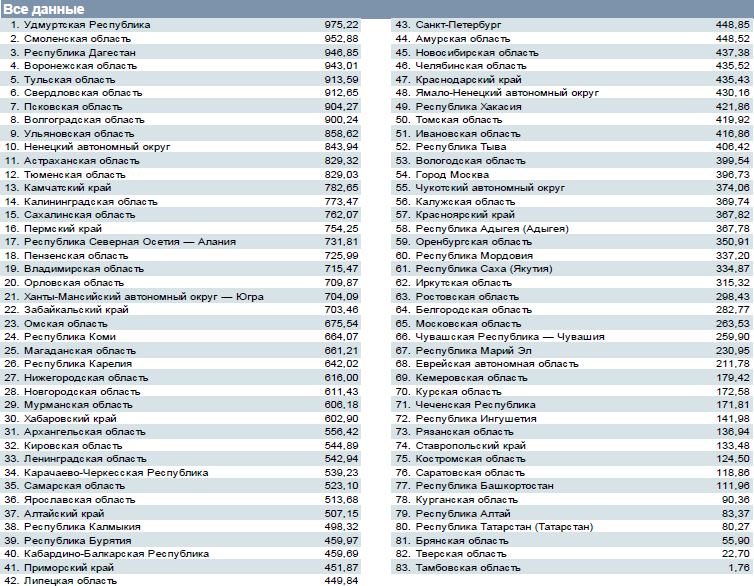
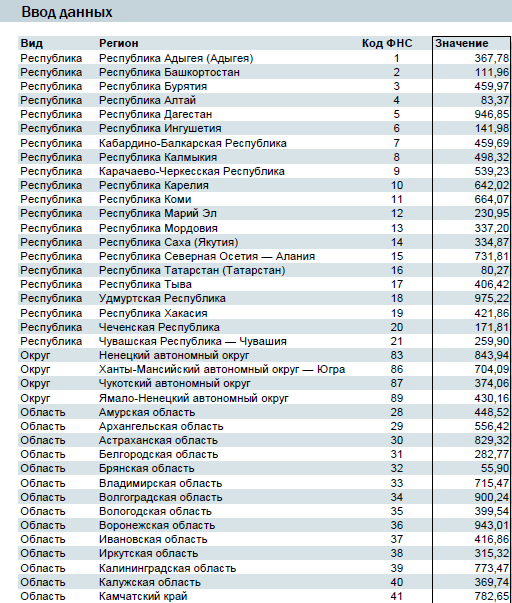
The heat map of the world includes all 83 regions of Russia.
To generate heat map is only necessary to fill in the table, enter the opposite where the value of each region. The rest will Excel: values \u200b\u200bwill break into groups, assign a color gradation for each of them, form a map of Russia.
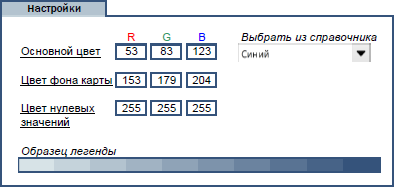
The heat map is possible to make the following settings:
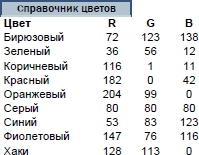
- Adjust the color gradation (enter the value of the dark). There is also a preconfigured reference of nine colors, which can be used to complement and further;
- Customize the background color of the card (by default, light blue);
- Set the color of zero (or empty) values \u200b\u200b(by default, white).
Printable versions optimized for Excel 2007+ (2007, 2010, 2013).
Using heat map will help a glance our study on a national scale, examples of which may include:
- Study the scope of export / import products,
- Study of the level of consumer prices,
- The study of indicators of industry,
- Research in living standards and employment,
- The study of indicators of budgets,
- Research the number of customer service points
and any other study.
By itself, the map is a vector image that can be copied into any application while preserving format. Thus, it is possible to scale the image without losing quality.
The heat map of the world includes all 83 regions of Russia.
To generate heat map is only necessary to fill in the table, enter the opposite where the value of each region. The rest will Excel: values \u200b\u200bwill break into groups, assign a color gradation for each of them, form a map of Russia.
The heat map is possible to make the following settings:
- Adjust the color gradation (enter the value of the dark). There is also a preconfigured reference of nine colors, which can be used to complement and further;
- Customize the background color of the card (by default, light blue);
- Set the color of zero (or empty) values \u200b\u200b(by default, white).